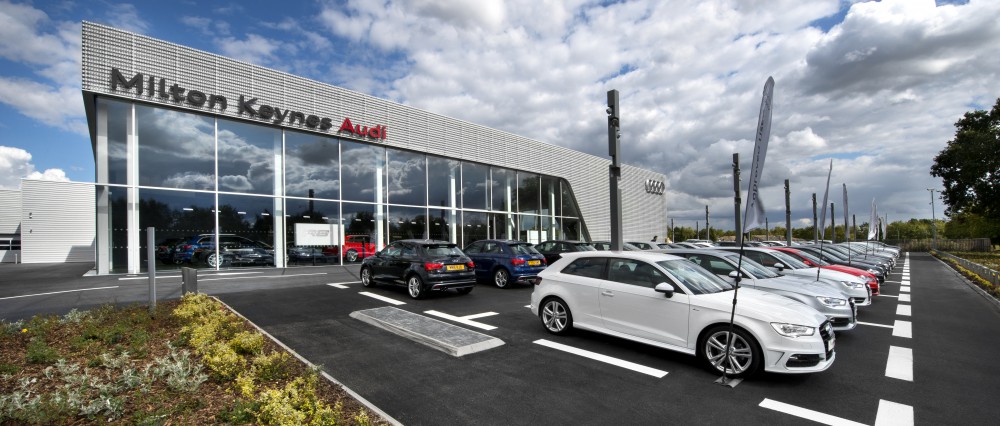
Nearly 2.5 million new cars were registered in 2014 – a 10-year high and 9.3% ahead of 2013. This trend has continued in 2015, data released by The Society of Motor Manufacturers and Traders (SMMT) show that in March this year the new car market grew for a 37th consecutive month.

Figure 1 shows the pattern of registrations over time overlaid with the SMMT projections that estimate 2015 to be another very good year for the industry. This may be an underestimate. For the general public fuel cost is uppermost in their mind when running a car. As fuel costs reduce, the cost of ownership falls, stimulating sales. The significantly lower cost of fuel is setting 2015 up as another very good year for car sales.
This is further supported by supply side factors. Until the civil war erupted in the Ukraine, vehicle production plans incorporated substantial growth in the Russian market in particular. Since then the impact of sanctions and resulting fall in the value of the rouble have left a large number of eastern-bound vehicles looking for a domestic buyer.
The property industry too had a good year in 2014 with double digit returns and a thriving occupational market. The optimism created has continued into the first half of 2015.
From the perspective of automotive property, 2014 was also a record year with some £460 million of dealerships transacted during the year – 70% by dealers, 30% by manufacturers.
A snapshot of the market in May 2015 sees a prime yield of 4.75% with an average yield of 6.5%.

The average size of transaction is around 20,000 square feet with a capital value of £170 per square foot. The average rent seen so far in 2015 is around £12.00 per square foot, which is well below the general level of market rents for modern dealerships.
INVESTMENT

Investors were active over the past year. Fund ownership of automotive dealerships in 2015 is estimated at around £1.4 billion. WP Carey, following their purchase of the Pendragon portfolio, hold over £230 million of dealerships. Other owners include Schroders, Aviva, Aberdeen Asset Management, LaSalle, Hermes, L&G, Threadneedle, F&C REIT and Royal London.
Prime yields have been falling since 2011 reaching 4.35% in 2014. This figure sits very well against comparable retail property between the High Street and Foodstores.
If prime yields sit between 4.5% and 5.5% – yields on secondary property lie
between 6.0% and 7.75%, influenced in particular by the length of the unexpired
lease term; presenting significant opportunities for improvement.

Regionally there is a spread of prime yields emanating from 4.35% in Greater London. As would be expected, values are the highest in Greater London and the South East where sites are short and competition is at its most fierce.

However, prime yields in the North West (Manchester) have moved below 5% in an active market. This demonstrates the opportunity for yield compression in regions like the East and West Midlands and Yorkshire where current primes sit 100 to 150 basis points above this level.
Looking at property market activity by marque over the year to May 2015 Ford dealerships saw almost a quarter of the transactions followed by Vauxhall with 15%.
Combined, the Volkswagen branded dealerships – VW, Audi, Seat and Skoda – also took some 15% of the market.
BMW and Jaguar Land Rover dealerships both saw around 9% of transactions – the latter boosted by their plans to integrate Jaguar and Land Rover brands into a new combined network.
These numbers however have been influenced by the WP Carey deal which transacted at the end of 2014. If this deal is ignored from the above analysis then the Volkswagen branded dealerships total around 22% of all transactions, Honda makes up around 12% and Mercedes Benz and Citroen both have 8%.
RENTAL PERFORMANCE

Average rents in the past year see a wide range by region. At the bottom of the table sit Scotland and Wales between £7 and £8 per square foot. Yorkshire and the Humber is not much above this level at £8.50.
Then there is a jump to between £12 and £13 per square foot that encompasses the North East, North West, East of England and the Midlands.
Finally there is a gradient rising from the South West (£16.50) through the South East (£17.80) to Greater London at £19.00.
CONCLUSIONS
2015 is delivering an active market. It is anticipated that these heightened levels of activity, coupled with a limited supply of property, will feed through into higher rents as new developments come on stream. It is anticipated that the pre-let market will signpost significant rental growth.
As dealers turnover and profitability increases, bolstered by enhanced new and used car sales, the number of vehicles on the road (the vehicle parc) increases. This correlates with an increase in servicing business which can account for some 65% of dealer profits.
Property is one of the biggest costs for dealers, after stock. Over the past year the pendulum has swung in favour of property owners with dealerships and dealership development sites being sought after and commanding premium prices. Unsurprisingly, rents are beginning to rise, evidenced in particular by new dealership developments. Prices are also being pushed higher by rising build costs.
2015 will continue to offer significant opportunities for investment based both on rising income and rising values.


